OUR TECHNOLOGY
Key factors to consider when processing the acquired data from the GPR device.
We interpret data using our in-house software. It was developed to answer the specific needs for in-depth analysis of our datasets. Our software allows us to process the GPR data in a unique way and provide an accurate evaluation of the structure’s condition.
We begin our process by checking the positioning and the spacing between the measurement profiles. This control is done either by inserting the radargrams on a 3D LiDAR image of the structure or by using GPS coordinates.
Then we identify key elements of the GPR data called features, which are generally material layers, rebars or prestressing cables, utilities, and defects. In the next step, we perform the calculation of the electromagnetic parameters for each feature.
At the difference to standard GPR analysis, we are able to calculate the electric conductivity, conductance and depth of each feature. This allows us to distinguish the location, the severity and the extent of a chemical disorder. With this information, we produce the corrosion risk map of the reinforcement and evaluate the most probable cause of degradation of the structure. This whole process is considered the first step of predictive maintenance.
Finally, our numerical approach allows us to establish statistics on the survey. These numbers can be compared with previous inspections and enable the possibility to evaluate the degradation rate of the structure. This corresponds to the second step of predictive maintenance.
Ground Penetrating Radar (GPR)
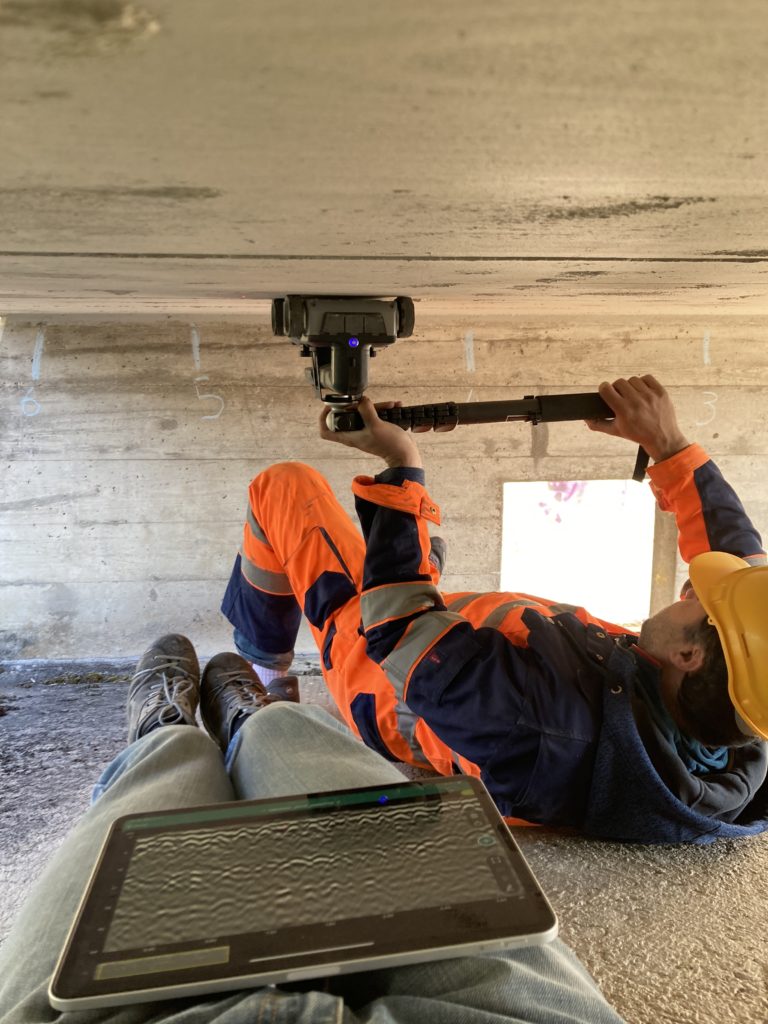
GPR is a non-destructive testing method based on the propagation of electromagnetic waves. The antenna emits waves that propagate through the structure. These waves are reflected towards the GPR when they encounter an obstacle.
The GPR records the arrival times of the different waves and sums them up as it progresses along the object under study. This sum of measurements forms a radargram which is a graphical representation of the structure and its components.
In a final step, the recorded arrival times are converted into distances by using the different propagation speeds of the waves. These propagation velocities are calibrated locally by means of soundings.
")
Conductivity
Electrical conductivity is the ability of a material or solution to conduct an electric current. It is expressed in Siemens per meter [S/m]. In concrete structures, conductivity varies according to the amount of ions in solution in the concrete pores. The electromagnetic wave emitted by the ground penetrating radar creates a local electric field that displaces the ions in the water in the pores. This displacement of ions consumes part of the energy of the wave. Conductivity is calculated by measuring the amount of dissipated energy.
The calculation of conductivity from GPR data is the result of the EPFL thesis n°5354 (2013) by Dr. Alexis Kalogropoulos.

Corrosion risk equation
The conductivity of the concrete cover reflects the risk of corrosion of the reinforcing bars:
Risk = Hazard x Vulnerability
Risk = Measured conductivity [S/m].
Hazard = Conductance [S], directly proportional to the contamination (% Cl-)
Vulnerability = Exposure of the reinforcing bars to contamination, inversely proportional to the cover thickness.
Thus, with equal contamination, conductivity decreases when the cover is thick (A) and increases when the cover decreases (C). Conversely, for the same cover thickness, conductivity increases for high contamination and decreases for lower contamination.

3D LiDAR
Whenever possible, we perform a 3D LiDAR scan of the studied object. This allows us to:
- Have an image of the structure on which we can project our maps in case the construction plans are missing.
- Link our results to visible defects of the structure.
- Recognize patterns in complex geometries.


Predictive maintenance & monitoring
Predictive maintenance is a well-established maintenance strategy in mechanical engineering. Its main idea is to schedule specific maintenance tasks on mechanical parts based on their condition and the speed of their degradation processes; the degradation speeds being derived from continuous or periodic monitoring.
In civil engineering, similar approaches exist but are limited to specific studies. Mid to long-term monitoring of steel bridges to estimate the remaining fatigue life of the governing elements and to plan their eventual strengthening could be seen as predictive maintenance. However, the principles of predictive maintenance are seldomly adopted when it comes to defining classical bridge maintenance strategies.
At Bridgology, we believe that following a predictive maintenance approach is necessary to tackle the enormous challenge of maintaining today’s ever-growing and aging infrastructure assets. We are convinced that our studies can be part of the solution and we are looking forward to explore the world of predictive maintenance.
How to perform GPR measurements to get the best results?
Our goal is to target our surveys to the specific needs of your project thanks to tailor-made solutions. For that reason, we will always identify the key challenges and discuss the objectives of the study with our clients before proceeding to the measurement campaign.
If available, we use construction plans, satellite images or pictures to define our measurement grid and manage the density of scanning. Our priority is to keep a balance between the cost of the study and the quality of information. Expensive information overload should be avoided in every study.
We work with any type of GPR equipment, however we prefer to use lightweight single antenna devices with a well-optimized scan layout. This allows us to efficiently scan large roads as well as less accessible surfaces, such as deck edges, retaining walls, soffits and the inside of box girders.

Quality control
We know that interpretations might be biased. To minimize errors and over-interpretations, we have implemented quality control measures.
- We use a systematic approach for data collection, processing and interpretation.
- A first evaluation of the structure is performed by the data analyst using minimum prior information. This ensures a non-biased interpretation of the scans.
- We use probing to ascertain the type of pollutant and its concentration. When enough probes are collected, we make a statistical analysis to evaluate the correspondence between the contamination and the GPR results.
- In a final step, the results are controlled from a geophysicist and from a civil engineering perspective. This ensures that the results are consistent with the type, the geometry and the material of the structure.
BRIDGOLOGY
Le Grand-Chemin 73
Epalinges, CH-1066
T +41 79 297 40 54
info@bridgology.com
©Bridgology 2025
Designed by Swiss Backstage