Contamination and corrosion risk
The contamination and corrosion risk maps are used to evaluate the chemical disorders of the cover concrete.
The chemical disorder analysis focuses on two elements. Firstly, we assess the vulnerability (thickness of the cover concrete) and the hazard (the contaminant concentration e.g. water and chlorides). Secondly, with this information, we can then qualify the likelihood of corrosion of the reinforcement and locate deficiencies within the waterproofing system.
Corrosion of the embedded reinforcement is the major deterioration process in reinforced concrete structures. This occurs when the chemical condition of the concrete around the rebar changes and contamination (most often chlorides) penetrates through the cover concrete and reaches the rebar. Once initiated, its process starts and gradually reduces the rebar diameter, affecting thereby the bearing capacity of the concerned element. Therefore, early detection of the cause of chloride ingress is needed in order to avoid this risk.
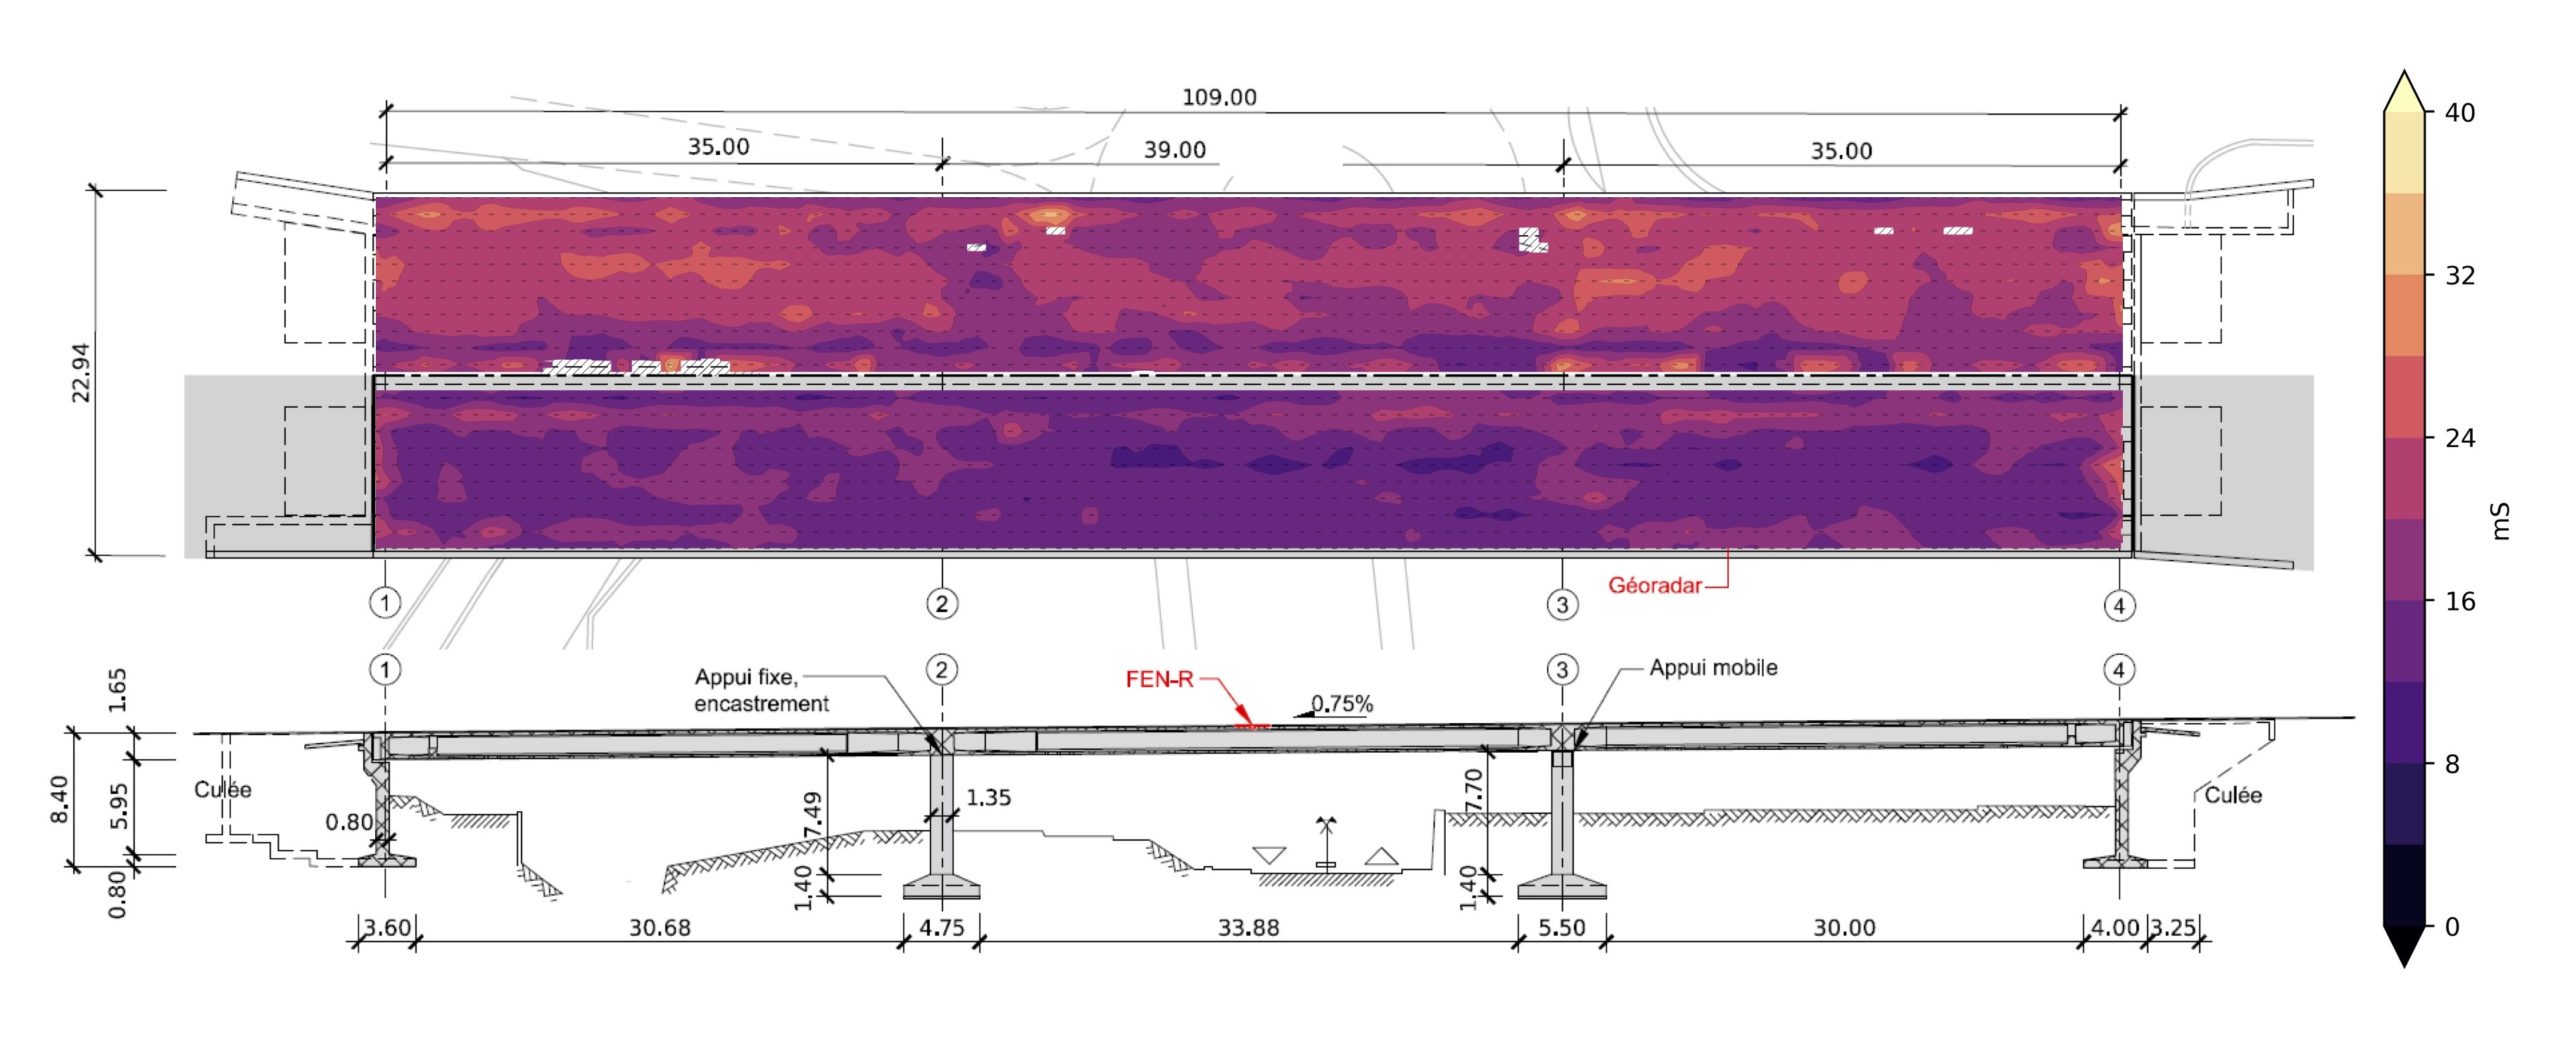
Contamination map
The contamination map represents the electric conductance of the cover concrete in mS. It unveils the relative magnitude and the extent of the total chemical contamination. It helps to identify waterproofing defects and potential water entry points. A quantitative interpretation of the map can be obtained by calibrating the conductance with results from chemical analyses performed on cores.
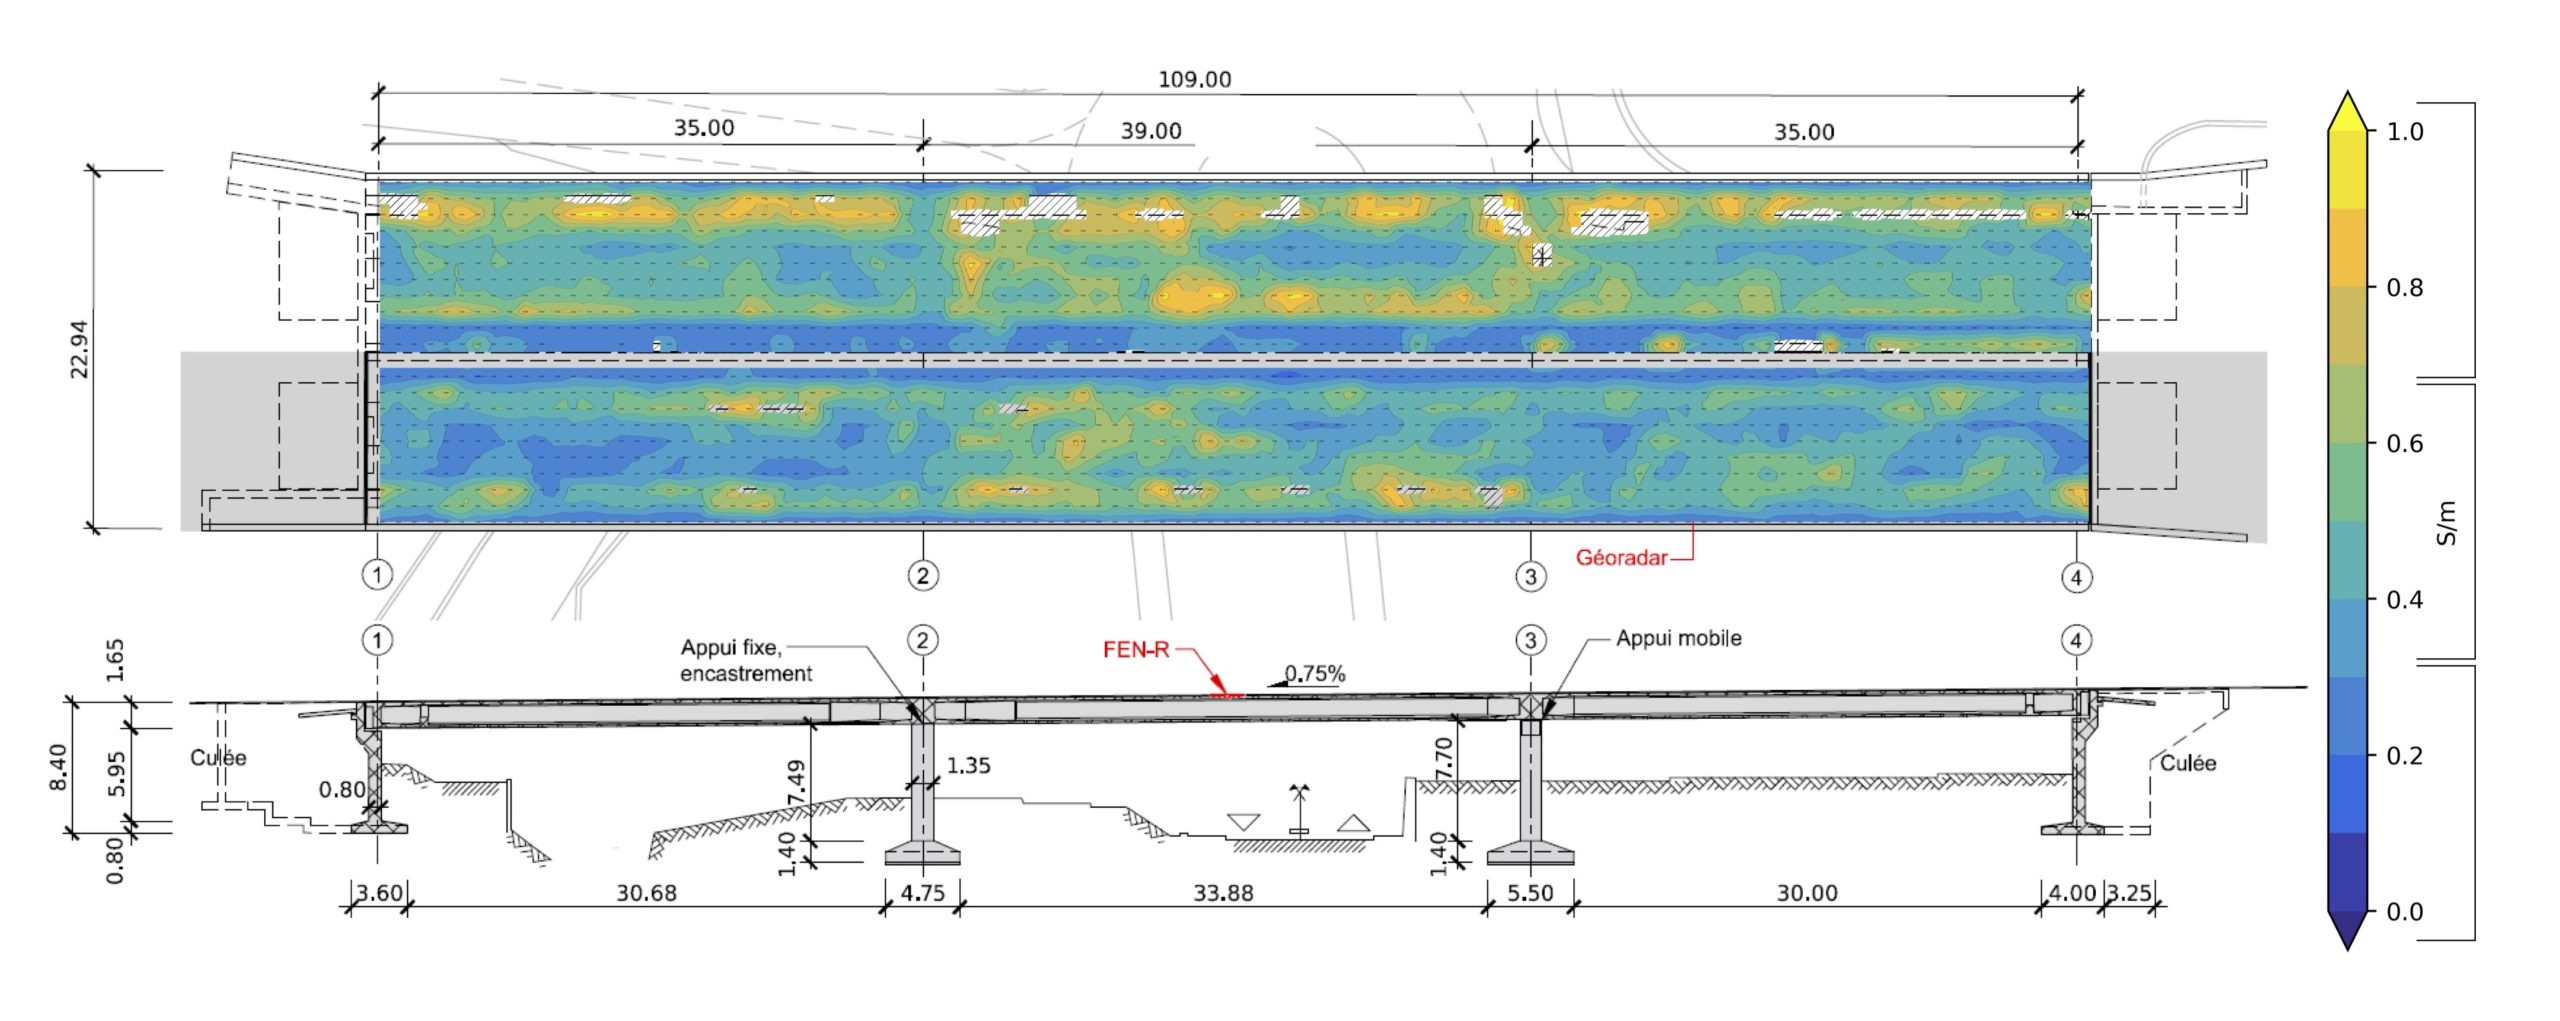
Corrosion risk map
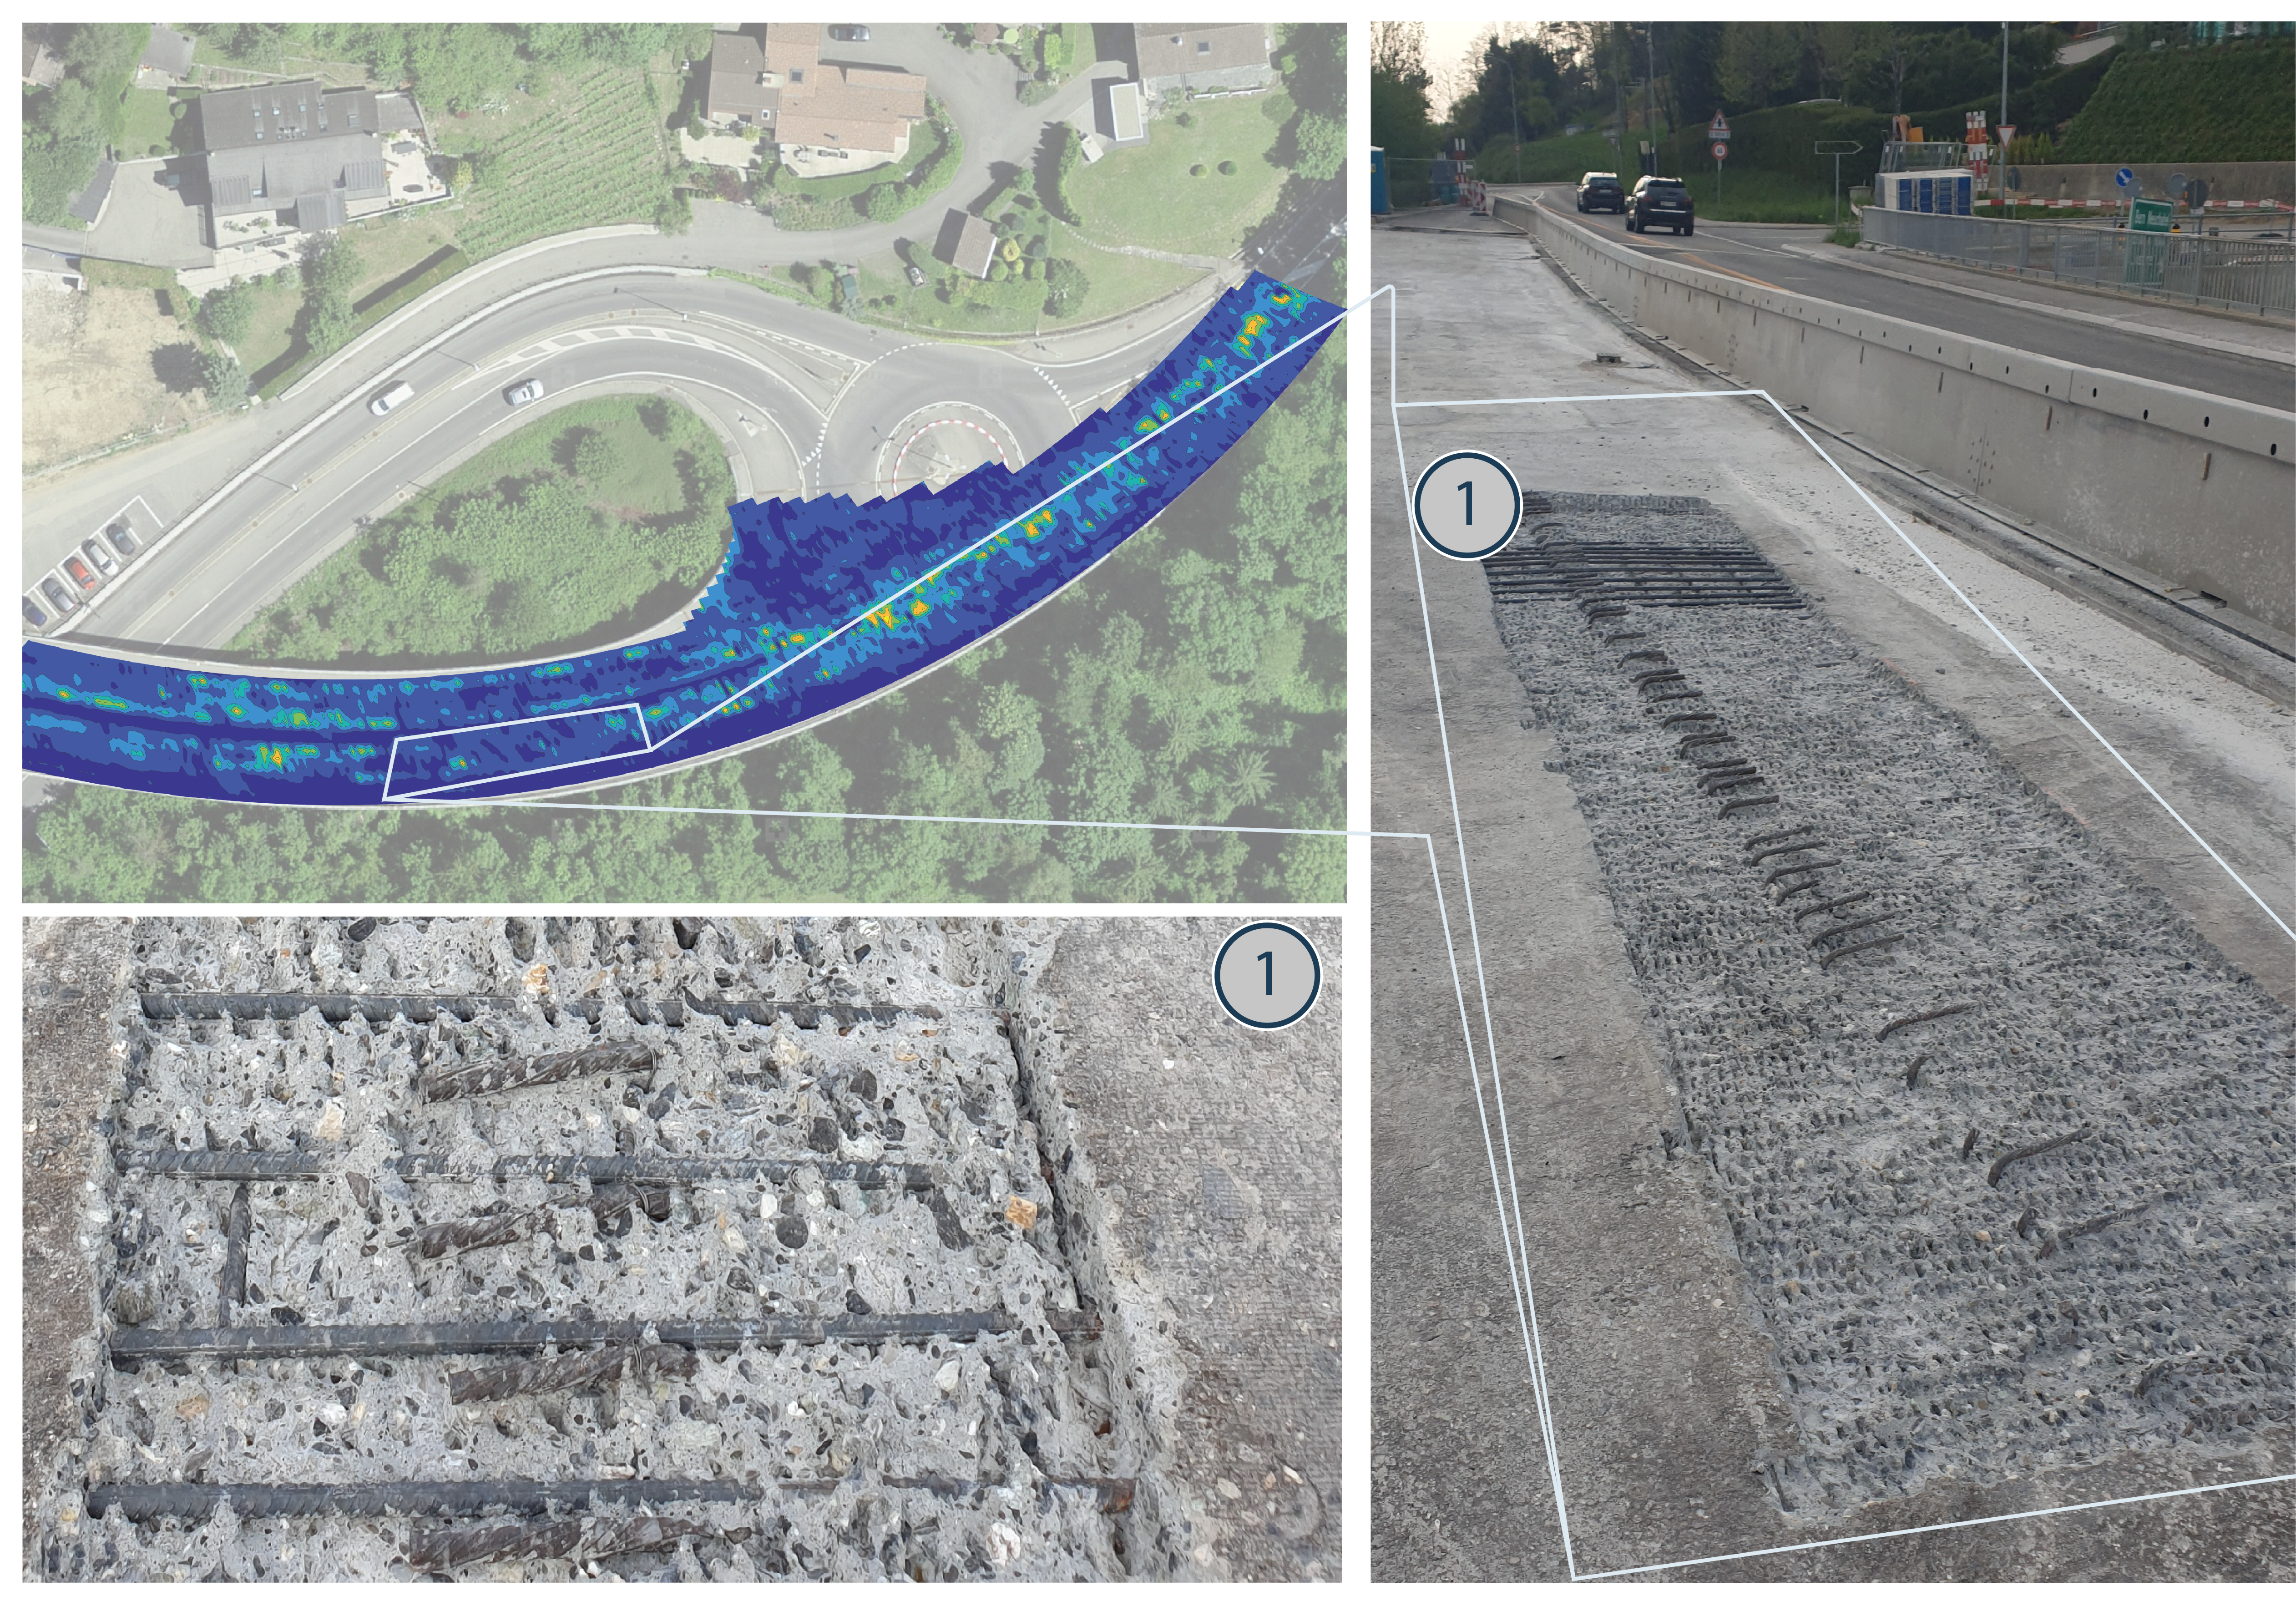
The corrosion risk map represents the electric conductivity of the cover concrete in S/m. It highlights the areas with a higher risk of rebar corrosion.
The map is based on the corrosion risk equation
Calibration
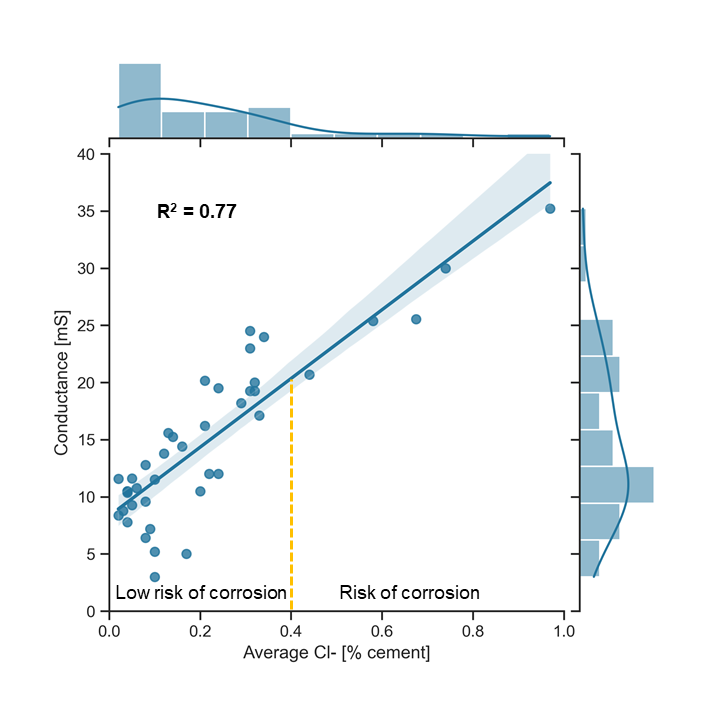
Our datasets are systematically calibrated, which consists in comparing the contamination values with the average Cl– concentration measured on cores taken from the structure.
We generally expect the correlation of the calibration to range between 75% to 85%. A correlation coefficient of 0.77 on our last 11 bridges (41 core samples) has been observed.
We also calibrate the thickness of the layers using cores whenever possible to increase our accuracy.
Verification
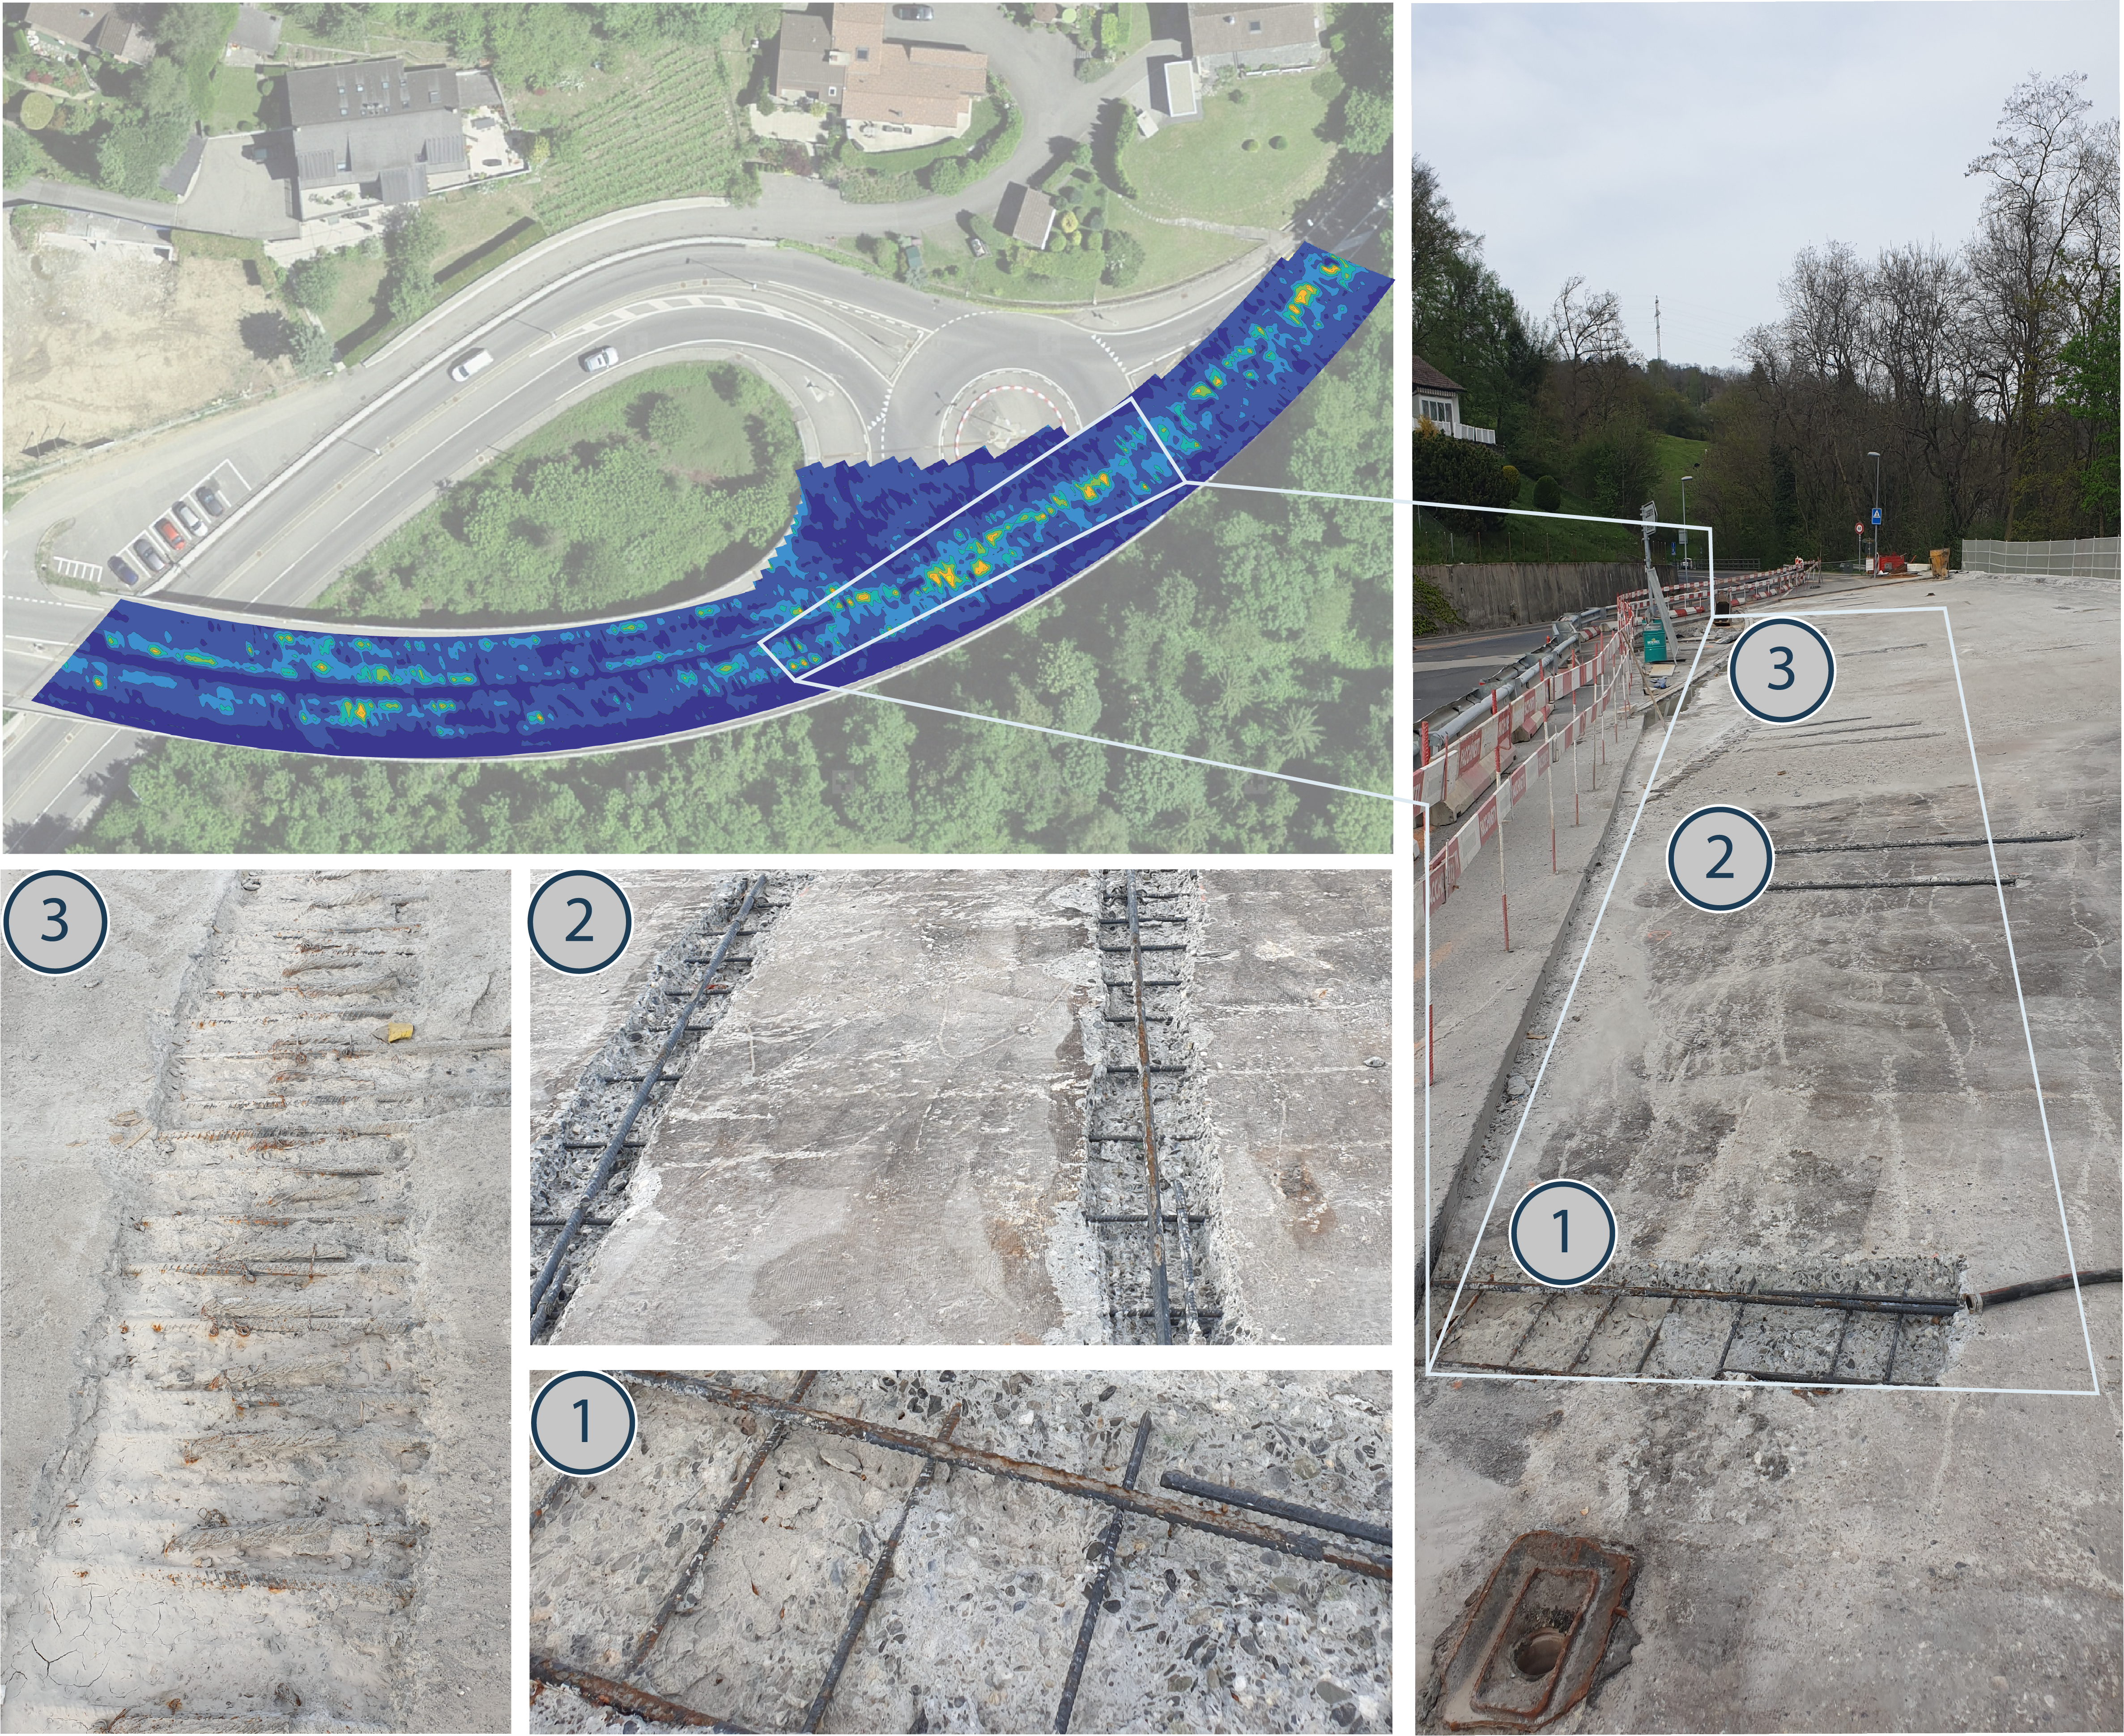
When possible, we ask our customers to send us feedback to evaluate the accuracy of our measurements. The following examples show the excellent accuracy of a corrosion risk map, which helps to identify corroded and non-corroded areas of the bridge deck. Similar results were obtained on 3 major bridges in Lavaux region (Switzerland).
BRIDGOLOGY
Le Grand-Chemin 73
Epalinges, CH-1066
T +41 79 297 40 54
info@bridgology.com
©Bridgology 2025
Designed by Swiss Backstage

